
New Visual Chart for Market Share
The “Markets” page in the Business Profile now looks a little bit more interesting
With our June release you can now see a visual chart that shows the market potential of your client companies.
Just add estimated numbers for Market size, Market potential, and Current Market in the client’s Business Profile. And of course the chart also show up in the PDF Business Profile.
With the visual chart of market share and potential you can:
Motivate your clients to fill out the market information to see instant charts.
make an even more attractive document for a bank or lender.
Start a conversation about what the market potential is and how to reach it.
The Details: Better visual overview of your client companies' market potential


#1 See the Market Potential
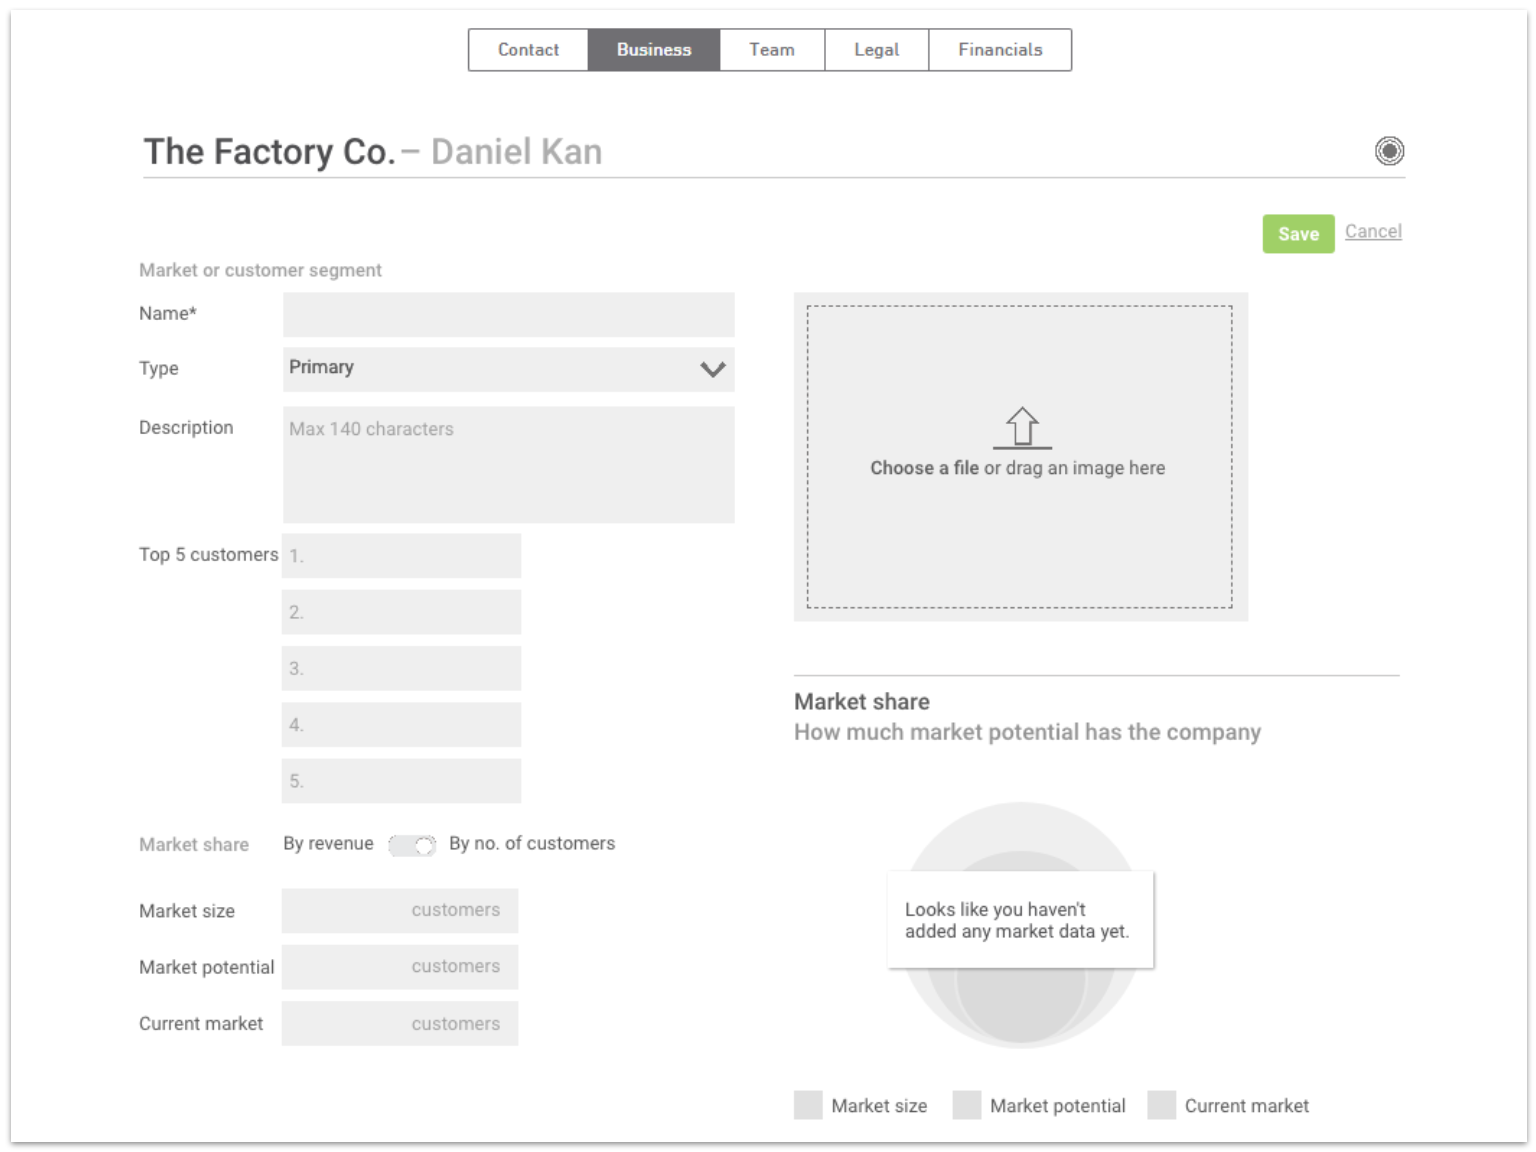
Fill out the forms: Market Size, Market Potential, and their Current Market to see the visual chart of your client companies’ market potential.
As you and your clients fill out how big is the market, what is their potential and current market, a visual chart will reflect the numbers.
#2 Choose to show the market chart by customers or by revenue
For each market you can choose for to show the market numbers by revenue or number of customers . In some cases you or the client might not know the market size by revenue, but can more easily estimate by number of clients.
#3 To showcase in a nice presentation
The chart will be added to your printable Business Profile ready to showcase other advisors, new partners, investors, bankers and more.